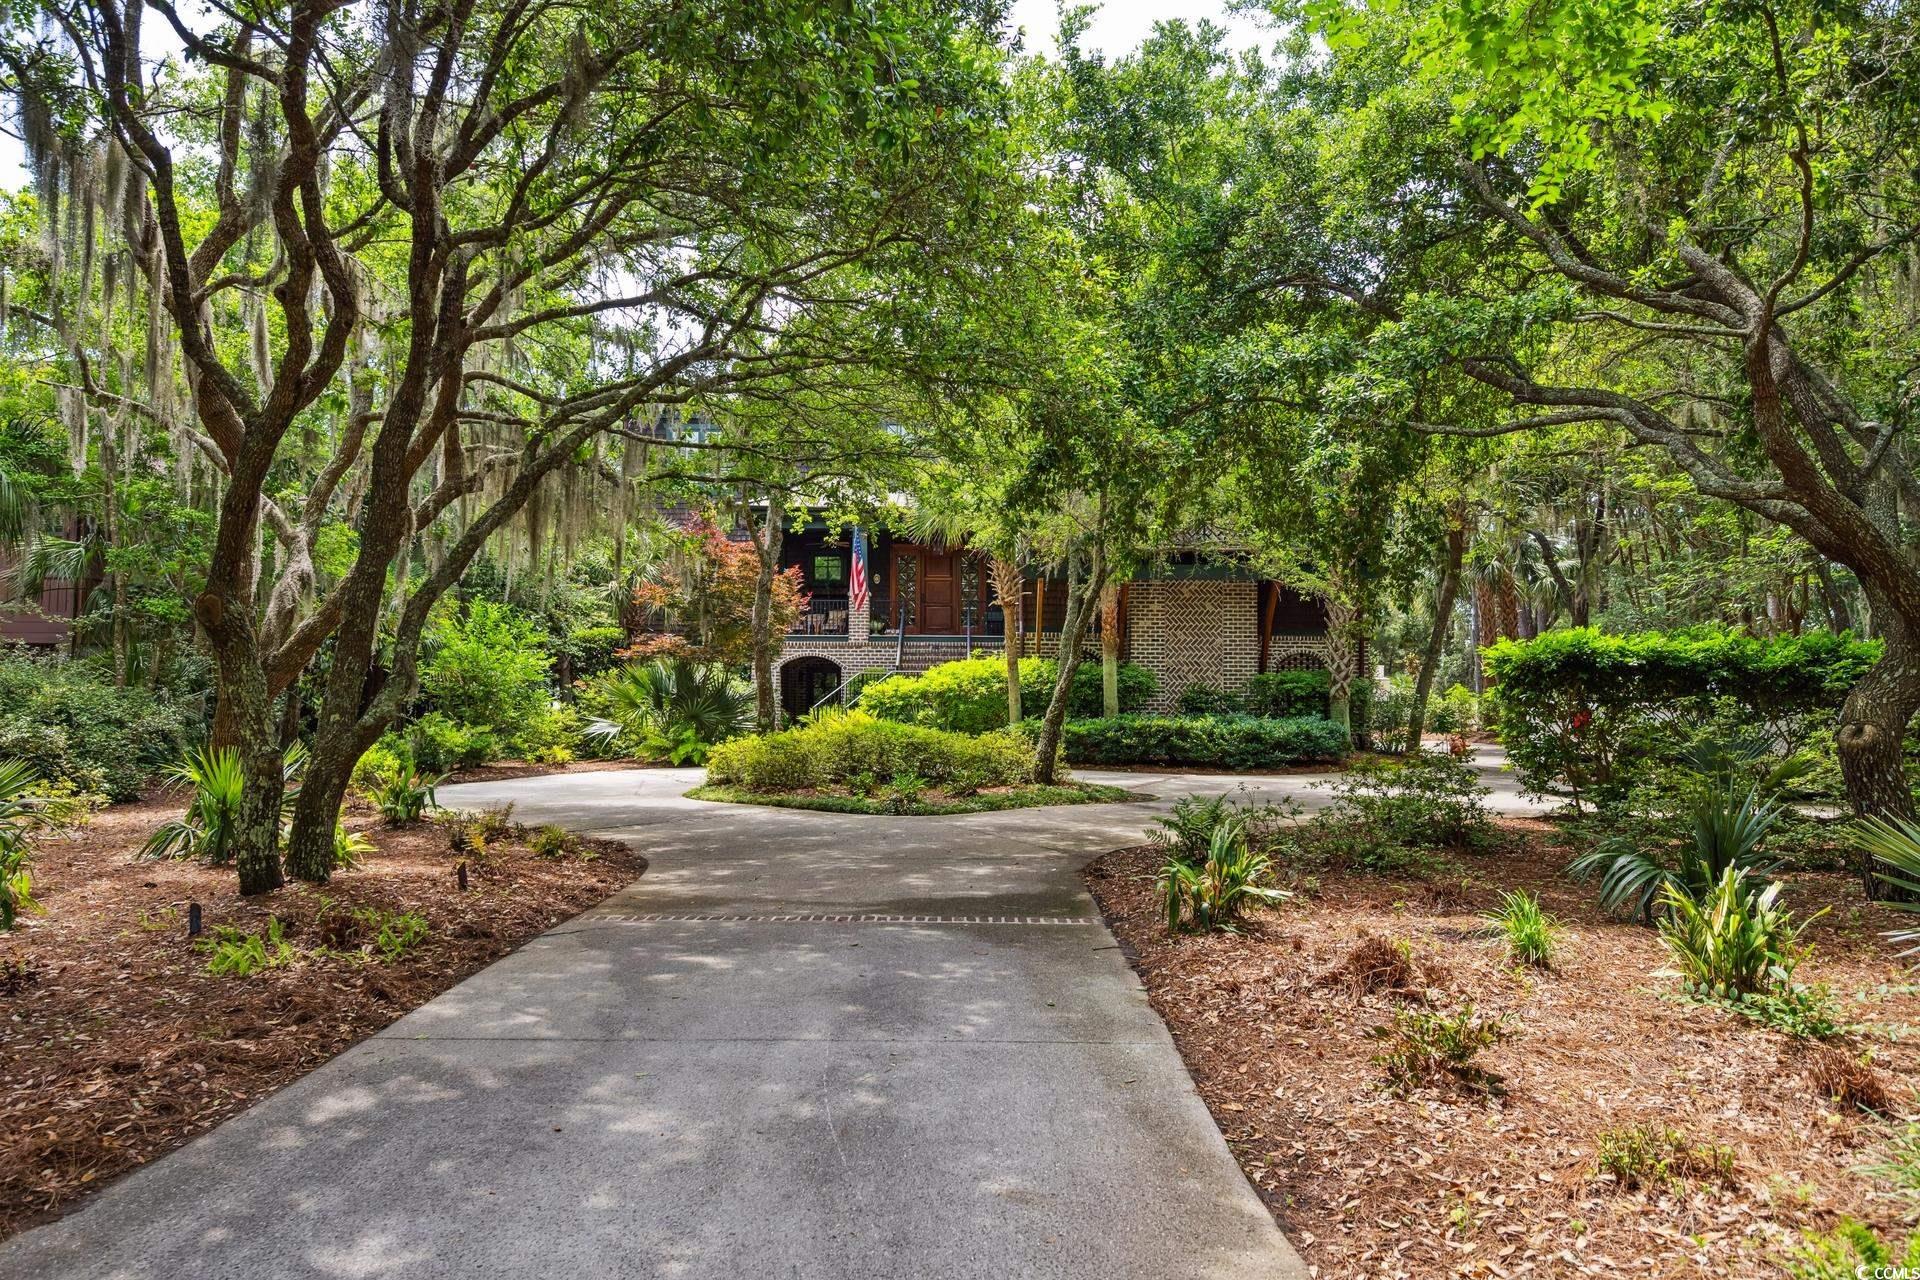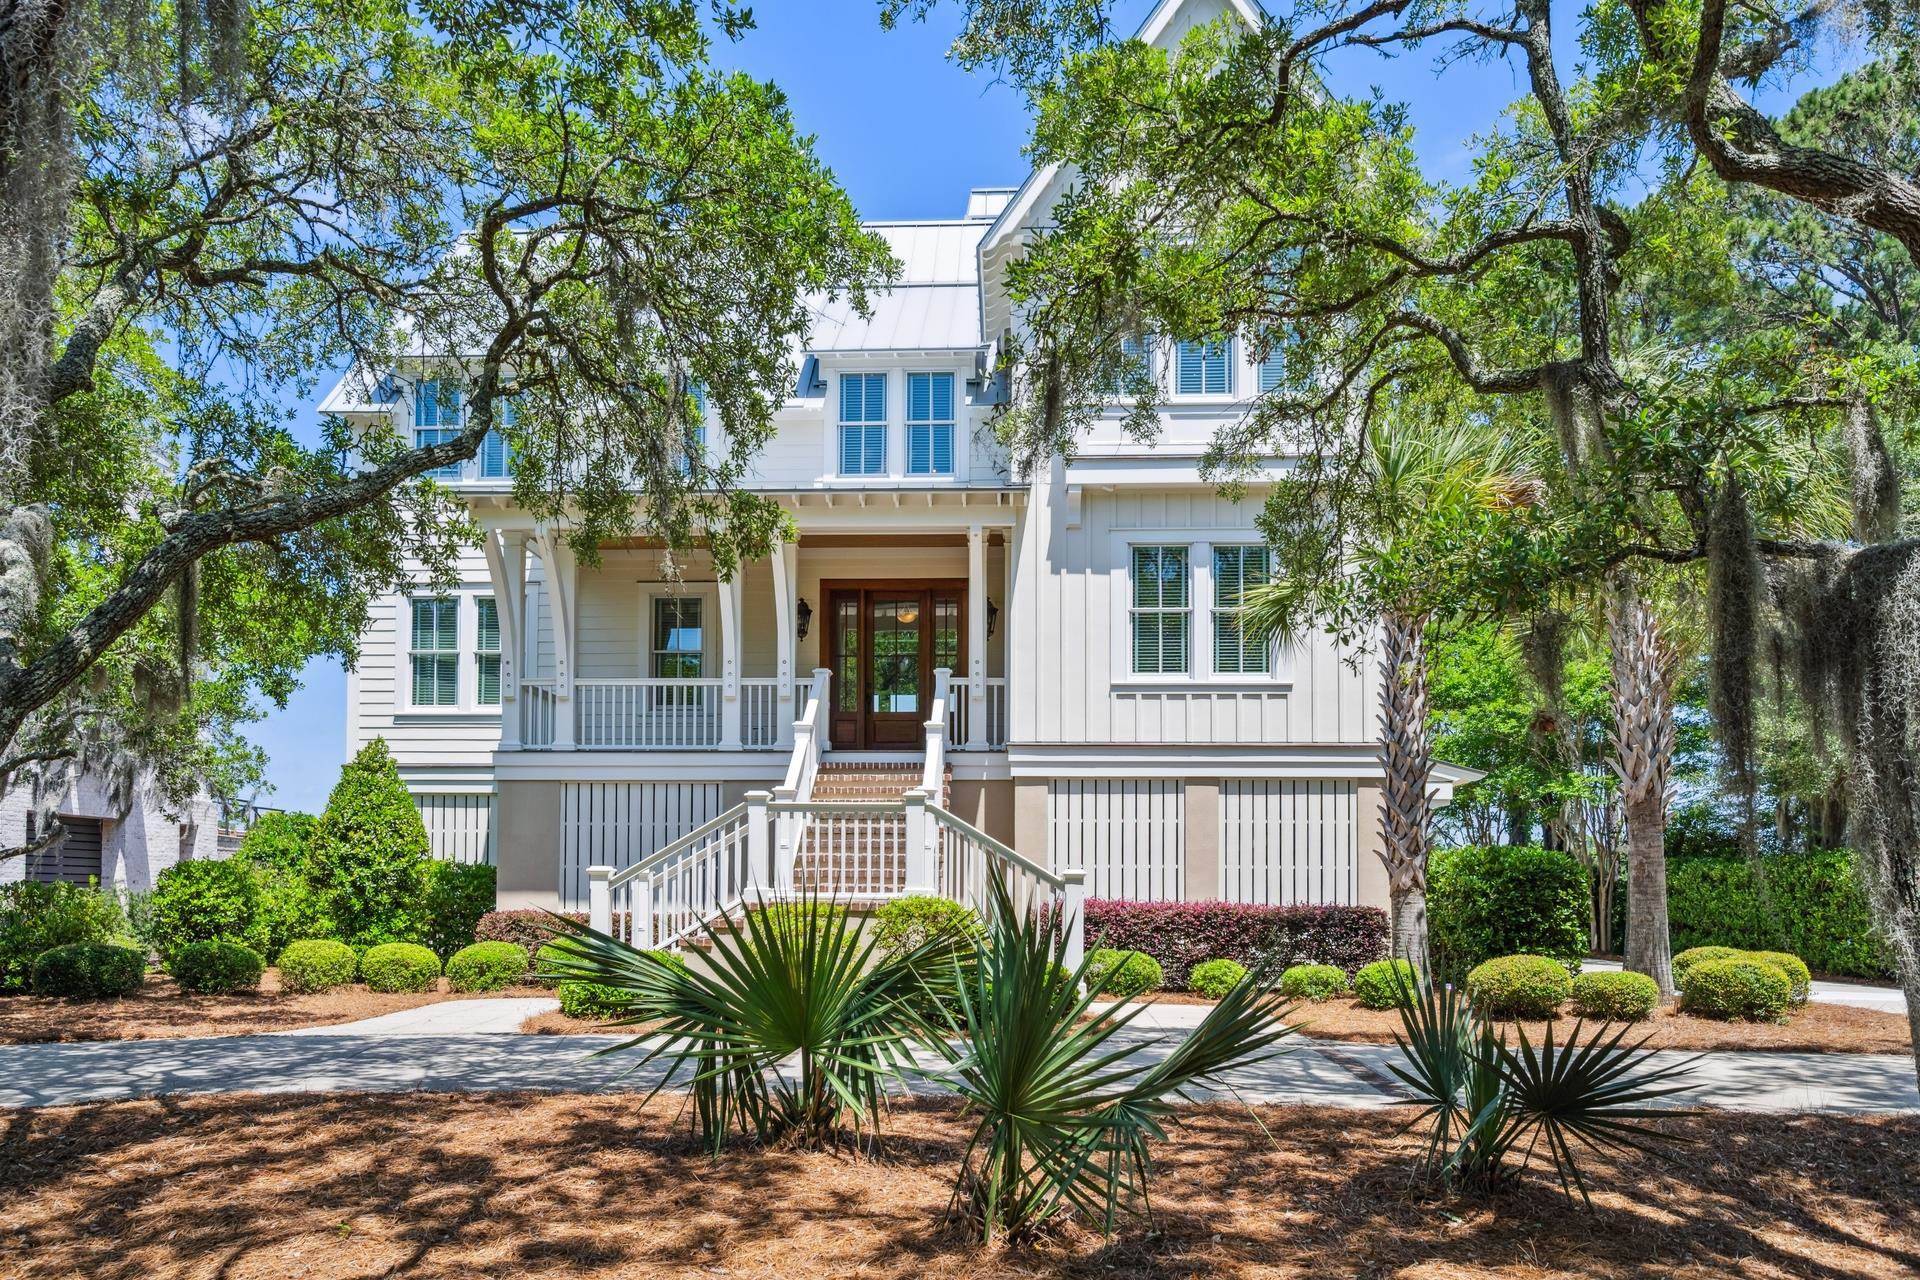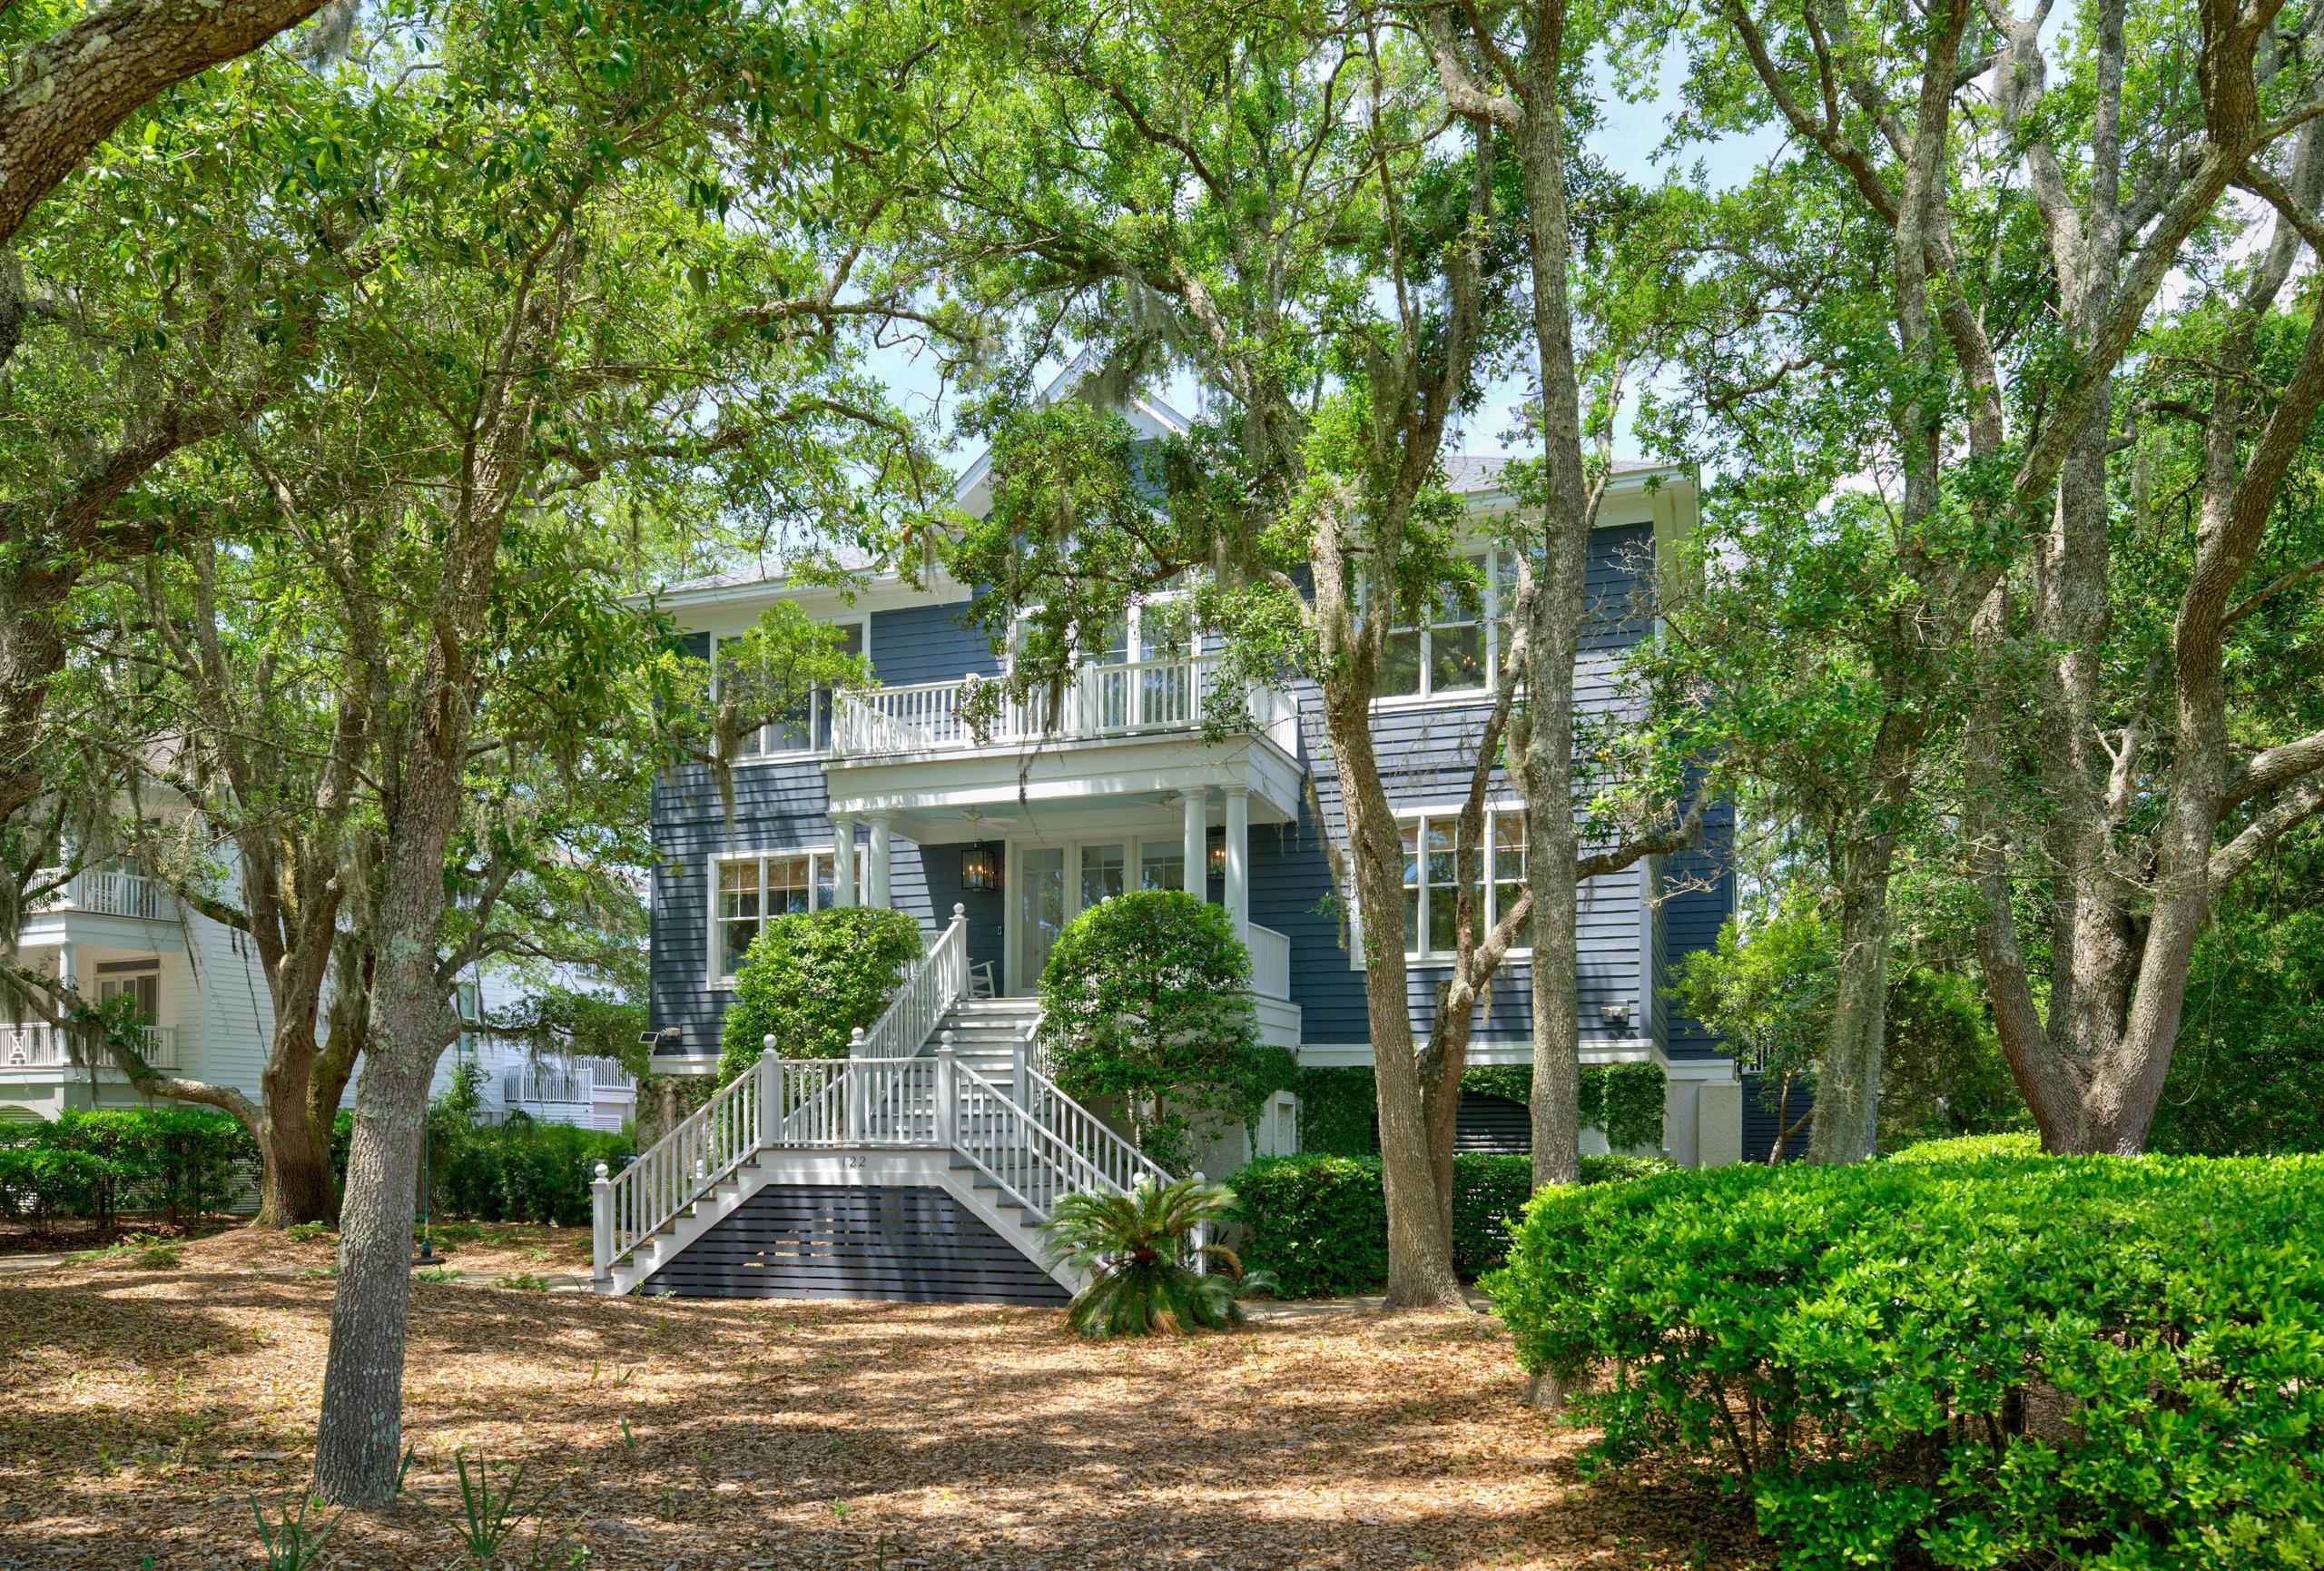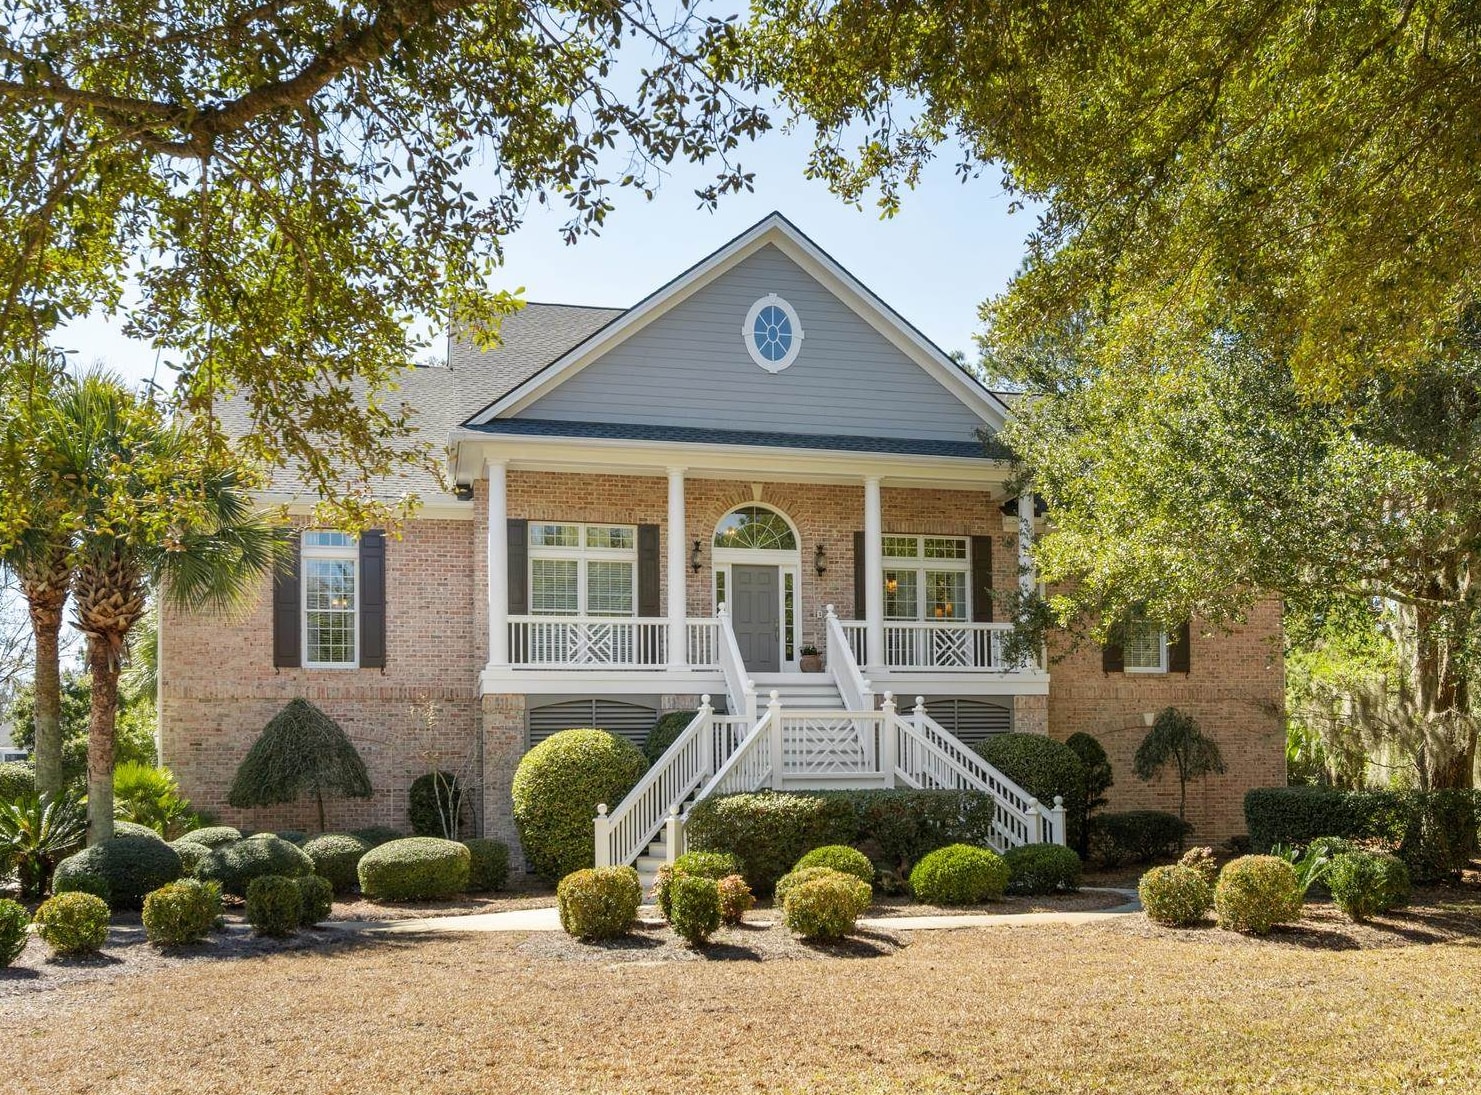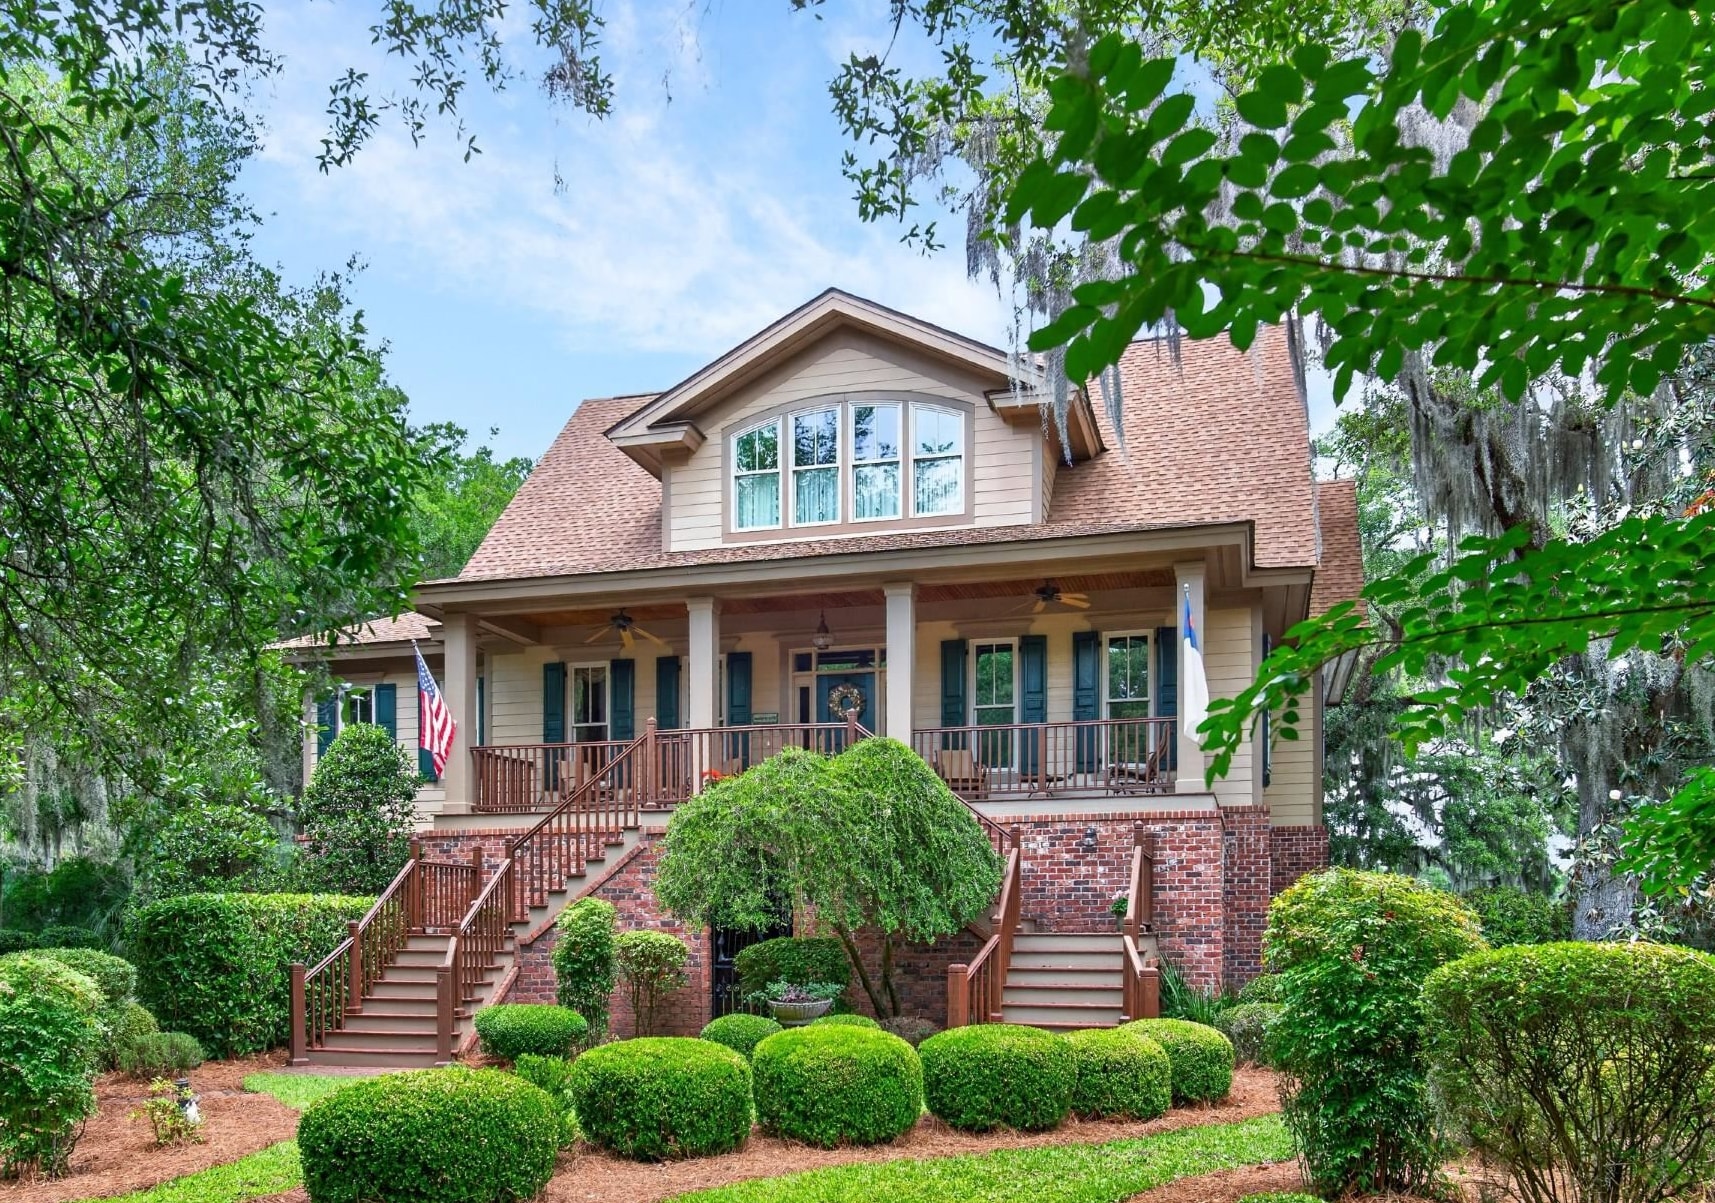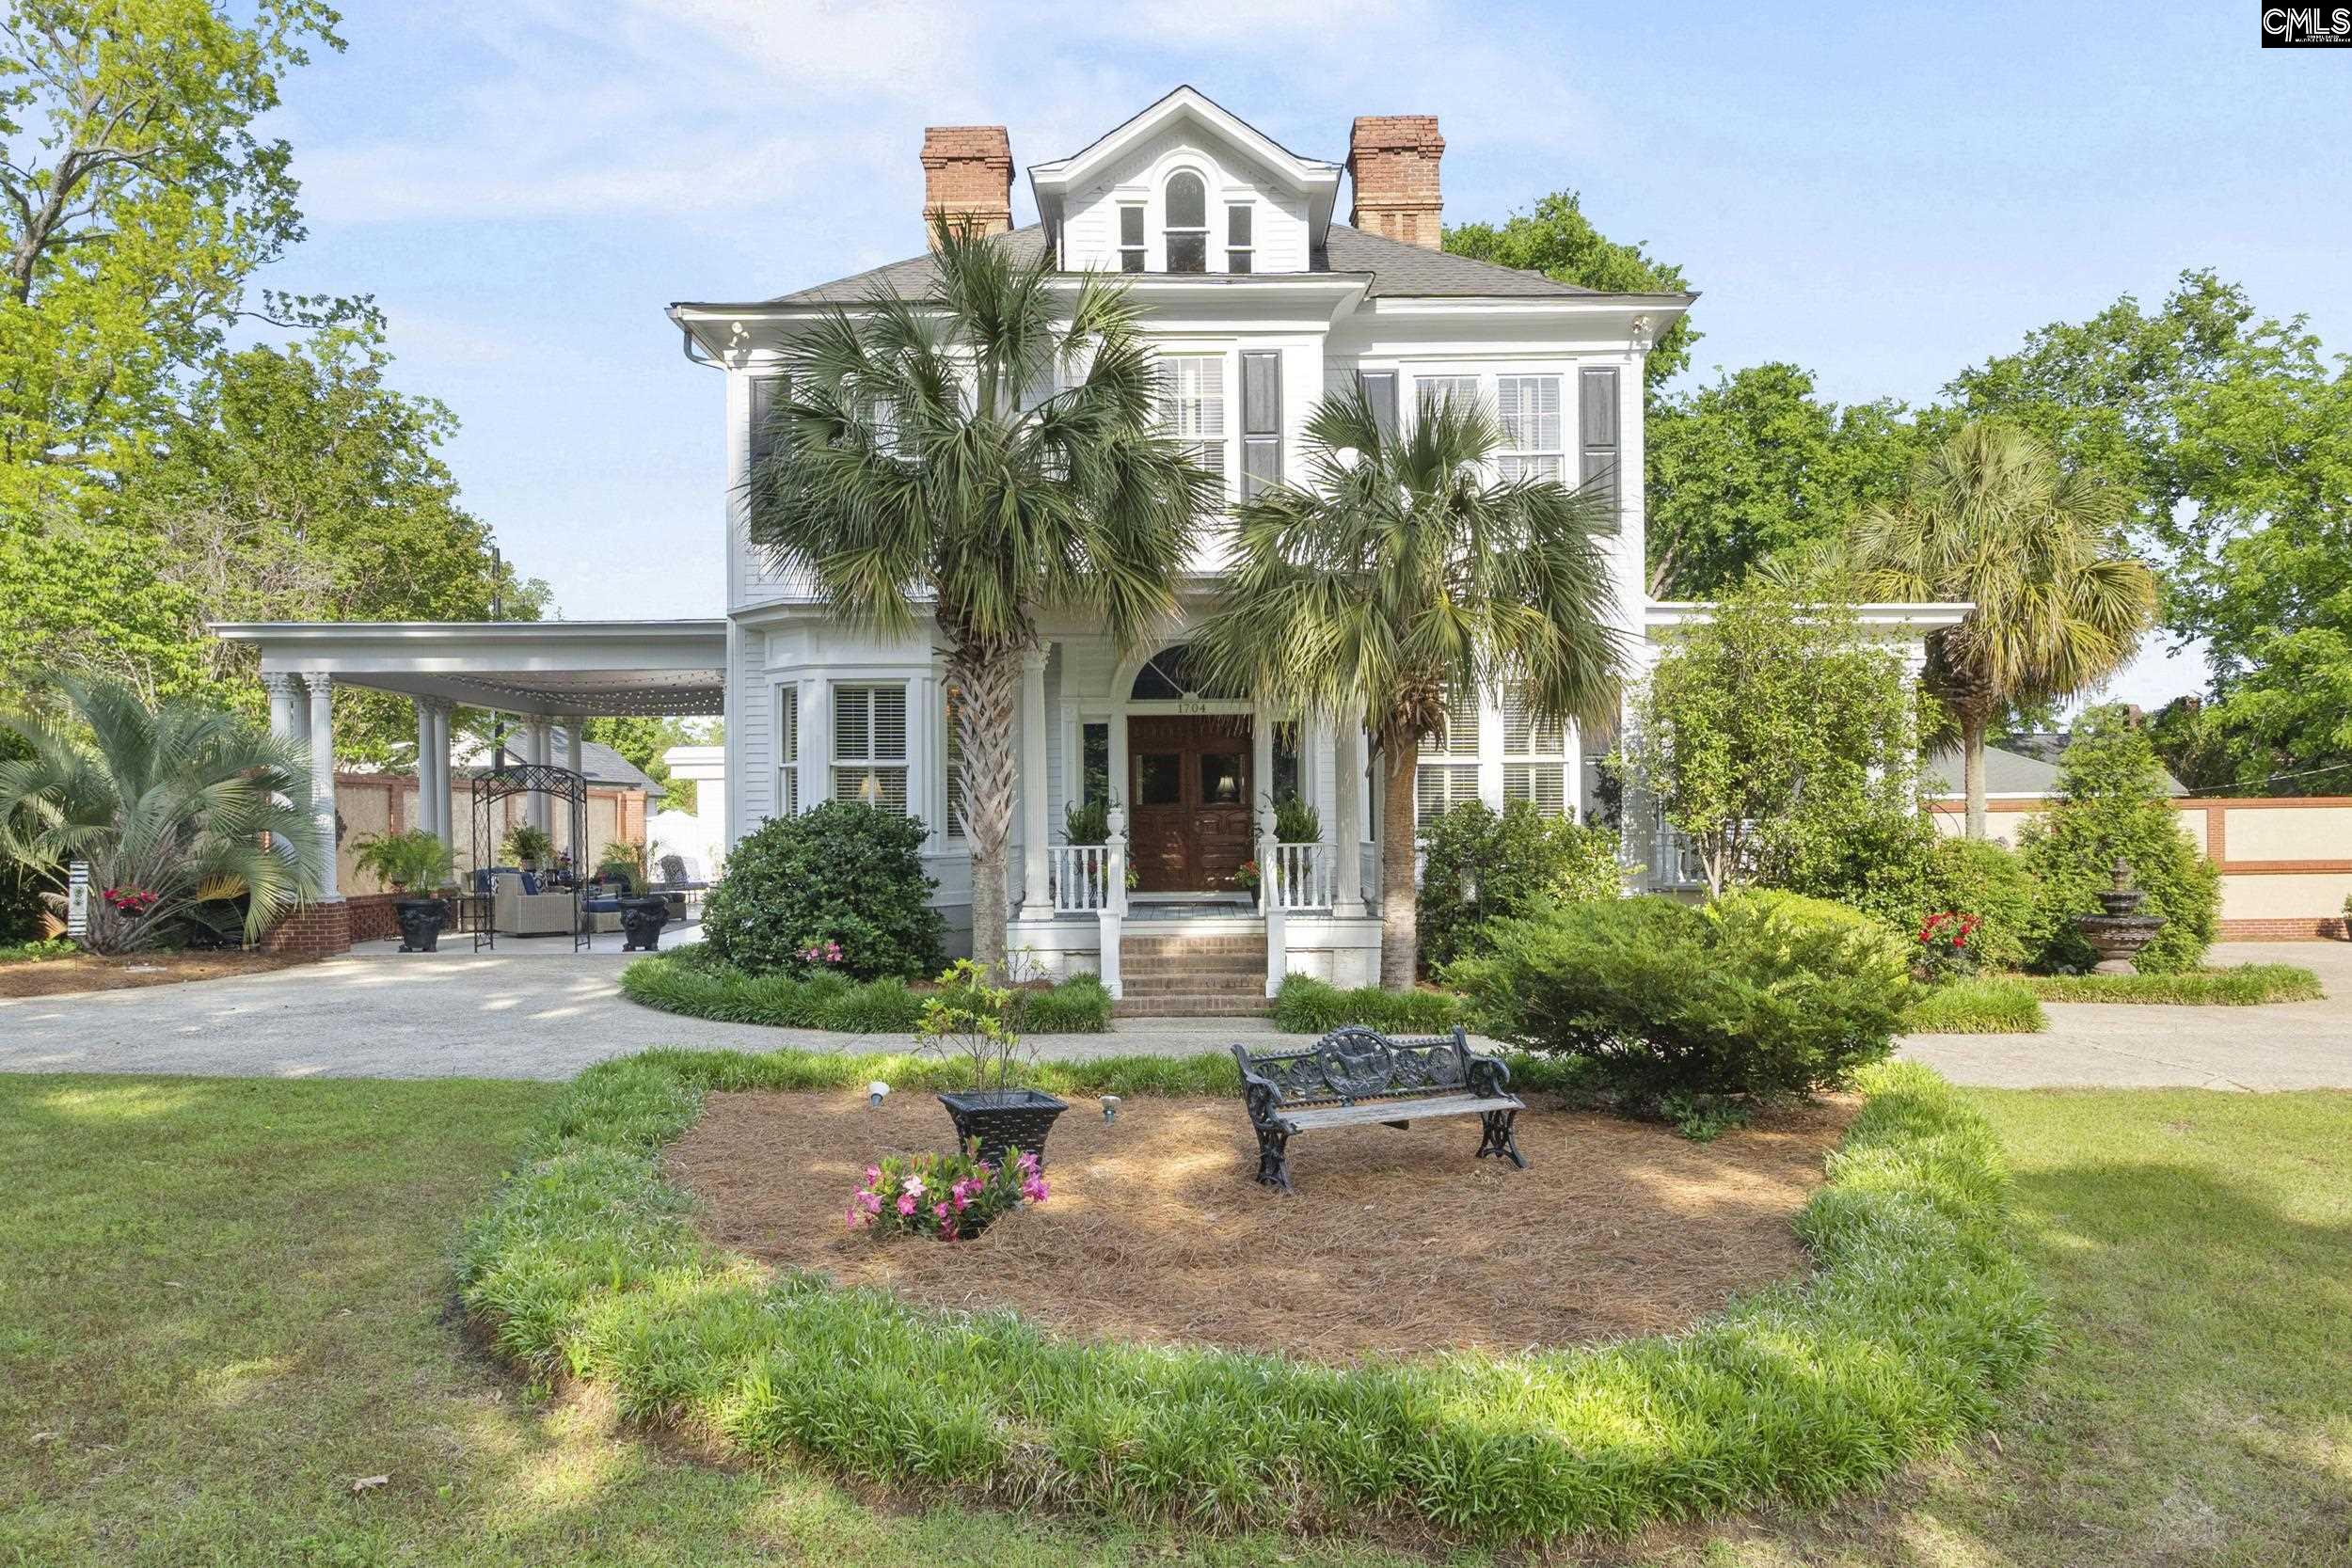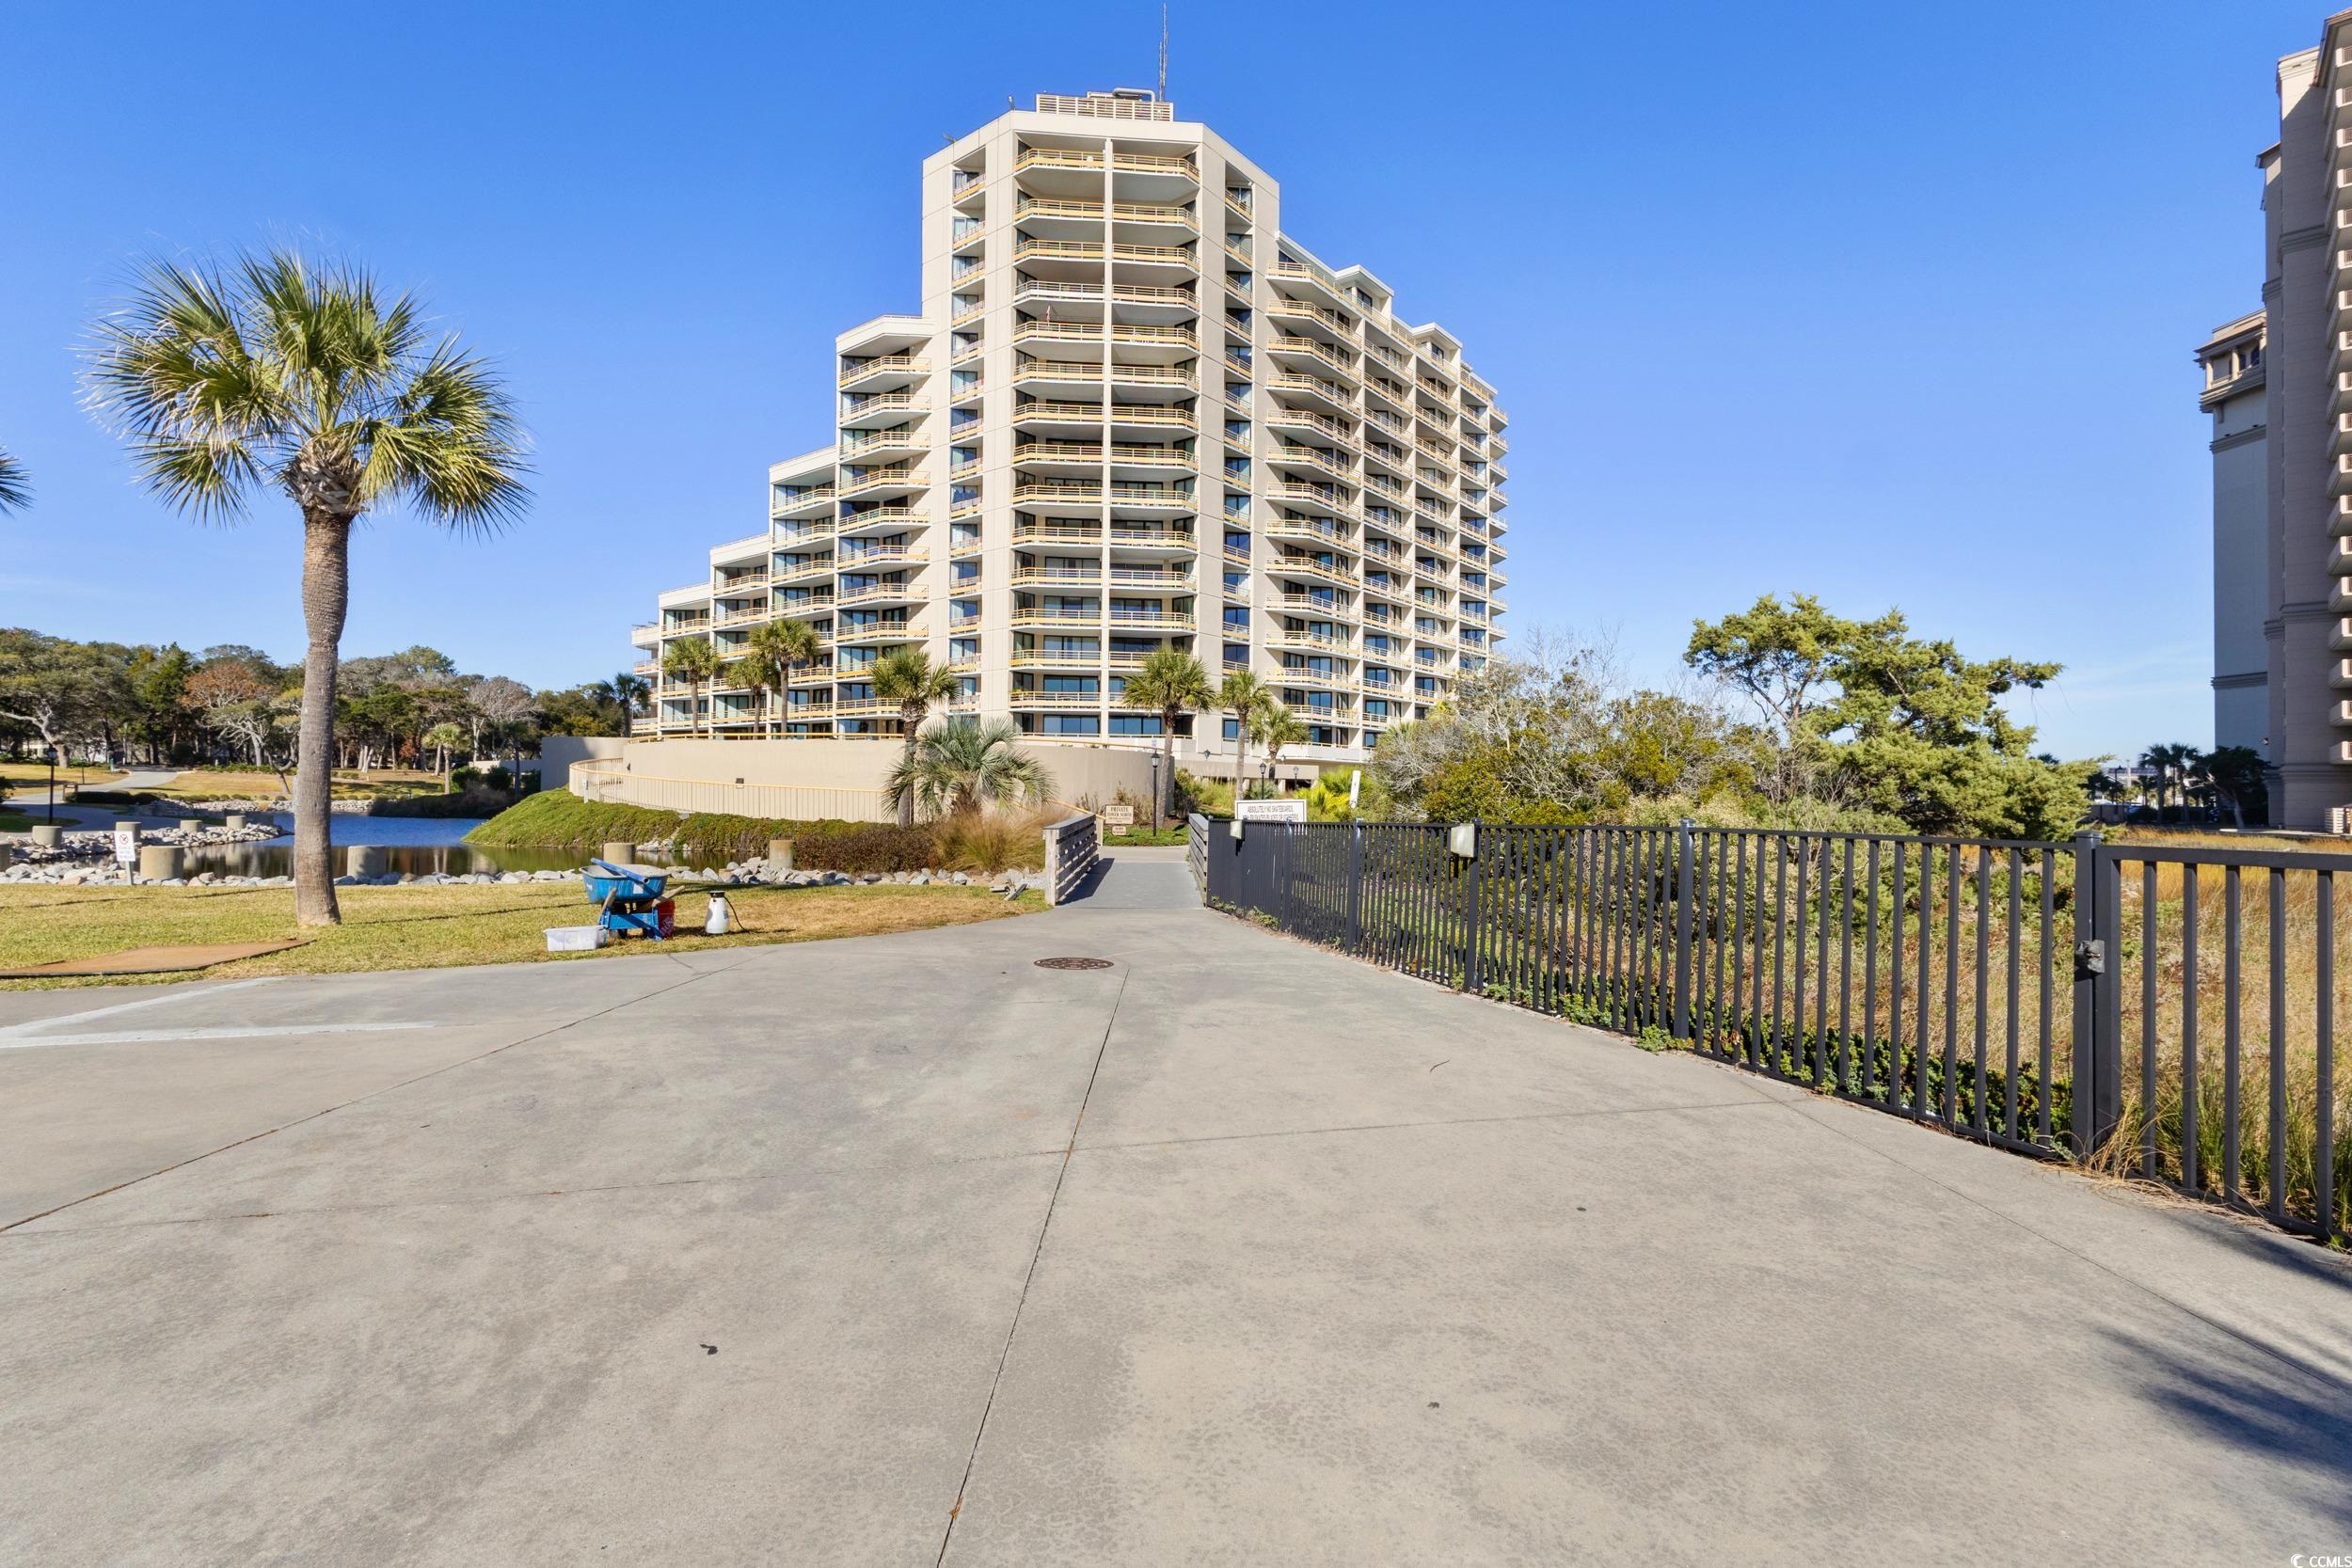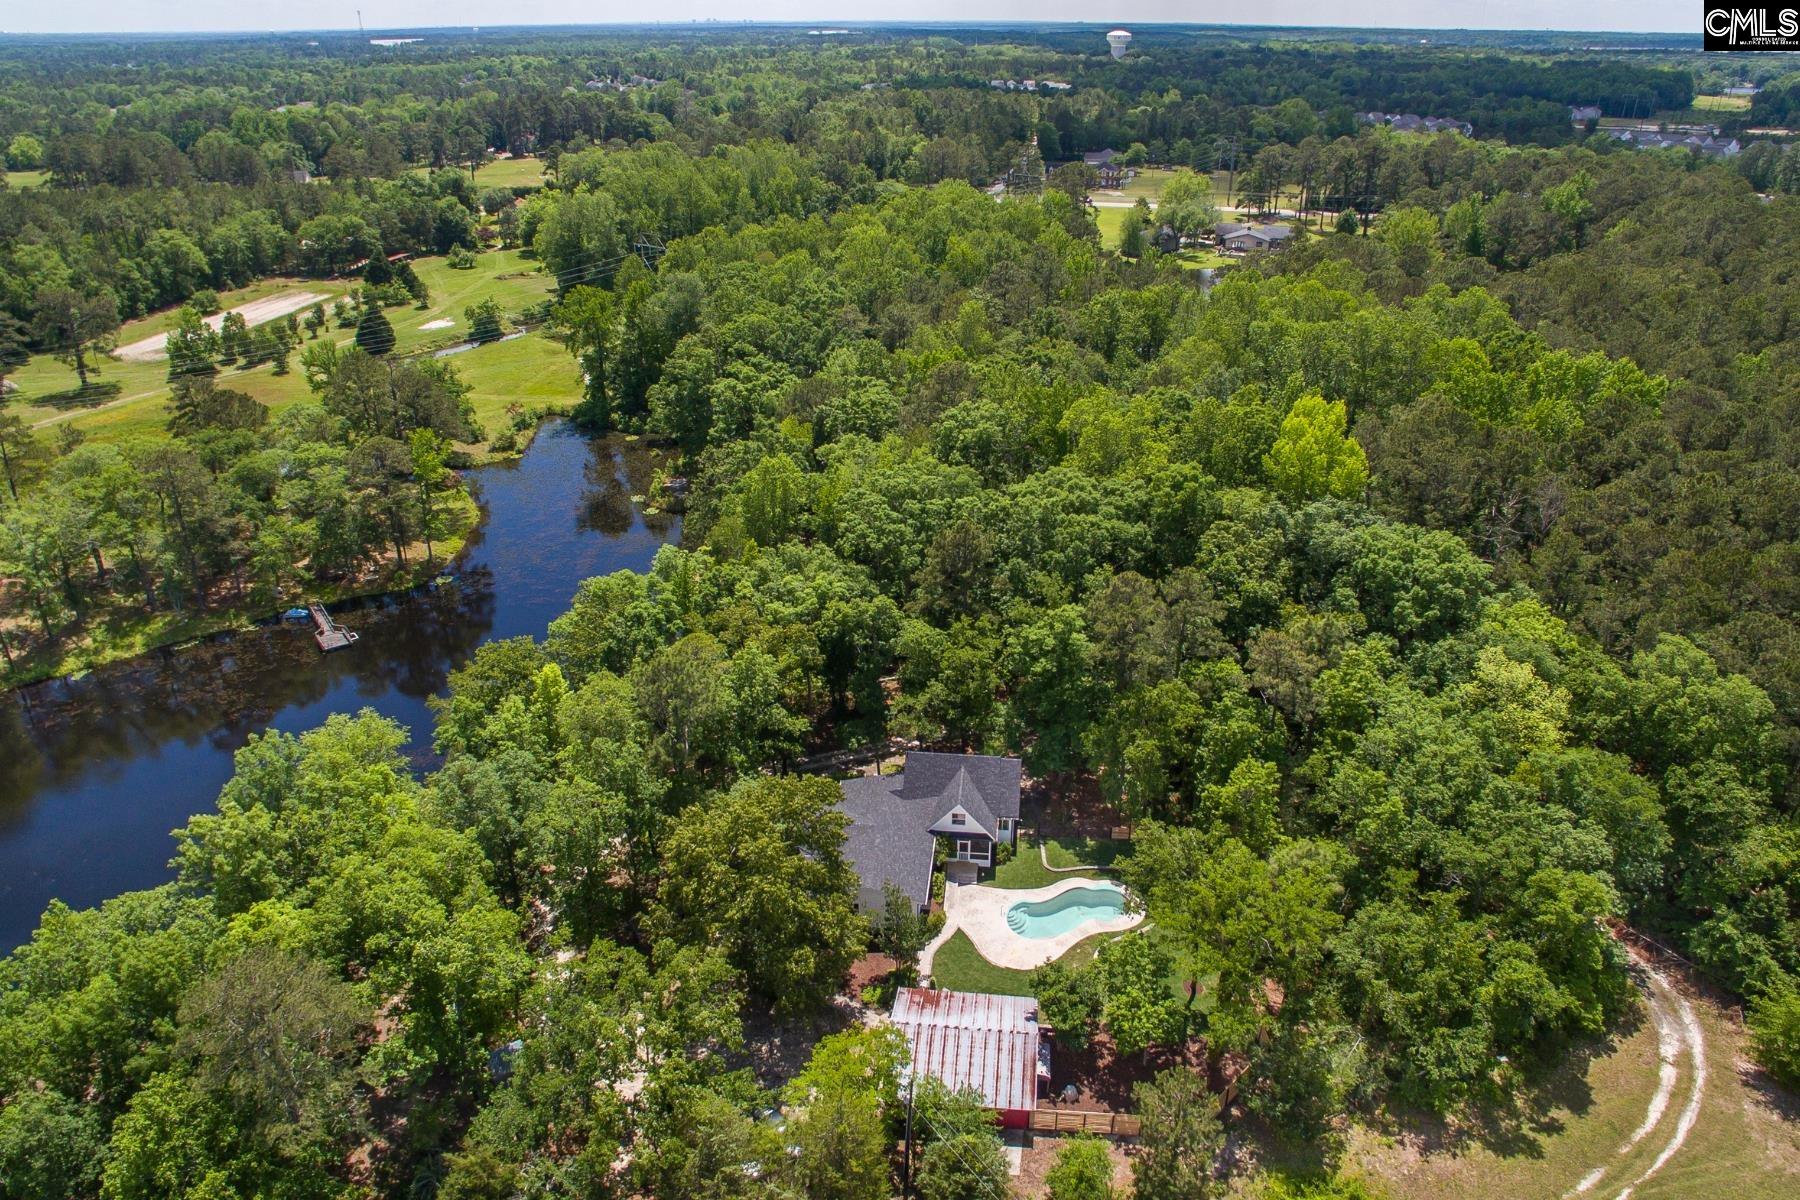
Welcome to
254 people live in Waterfall, where the median age is 34 and the average individual income is $72,045. Data provided by the U.S. Census Bureau.
Total Population
Median Age
Population Density
Average individual Income
There's plenty to do around Waterfall, including shopping, dining, nightlife, parks, and more. Data provided by Walk Score and Yelp.
Explore popular things to do in the area, including Progressive Riding Program, CrossFit Durable, and Battlefield Jiu Jitsu.
| Name | Category | Distance | Reviews |
Ratings by
Yelp
|
|---|---|---|---|---|
| Active | 2.98 miles | 6 reviews | 5/5 stars | |
| Active | 2.33 miles | 8 reviews | 5/5 stars | |
| Active | 4.42 miles | 6 reviews | 5/5 stars | |
| Active | 3.82 miles | 10 reviews | 5/5 stars | |
| Beauty | 4.09 miles | 5 reviews | 5/5 stars | |
| Beauty | 3.87 miles | 10 reviews | 5/5 stars | |
| Beauty | 4.51 miles | 24 reviews | 5/5 stars | |
|
|
||||
|
|
||||
|
|
||||
|
|
||||
|
|
||||
|
|
Waterfall has 75 households, with an average household size of 4. Data provided by the U.S. Census Bureau. Here’s what the people living in Waterfall do for work — and how long it takes them to get there. Data provided by the U.S. Census Bureau. 254 people call Waterfall home. The population density is 7,199.55 and the largest age group is Data provided by the U.S. Census Bureau.
Total Population
Population Density Population Density This is the number of people per square mile in a neighborhood.
Median Age
Men vs Women
Population by Age Group
0-9 Years
10-17 Years
18-24 Years
25-64 Years
65-74 Years
75+ Years
Education Level
Total Households
Average Household Size
Average individual Income
Households with Children
With Children:
Without Children:
Blue vs White Collar Workers
Blue Collar:
White Collar:

35 Capers Way Pawleys Island SC 29585
35 Capers Way Pawleys Island SC 29585